Weather Station with Web UI


Summer is here and because I like to know how hot it is outside I built a small weather station based on a Espruino Pico. The weather station has a built-in web UI to check the temperature from a computer or mobile phone. The UI is self-contained and hosted directly on the Espruino. No Internet necessary.
This is what we will build:
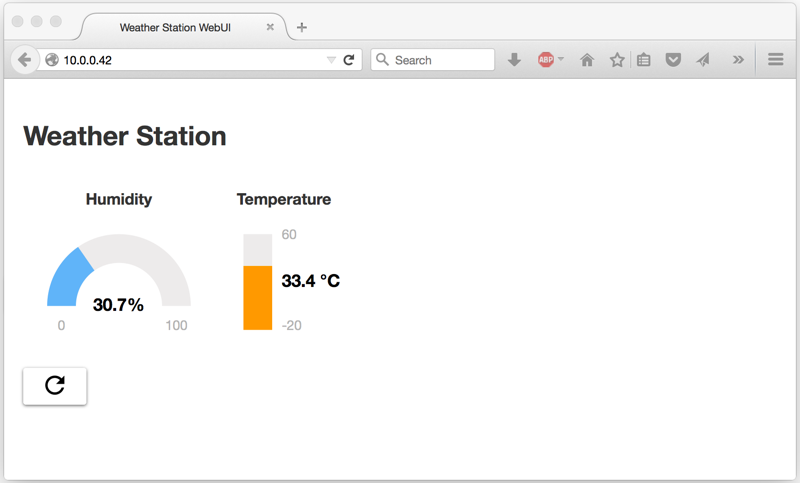
Btw. the screenshot shows the current temperature in my apartment. Time to buy an AC!
Hardware
You need the following parts:
- Espruino
- WIFI module (ESP8266)
- Temp. module (HTU21D-F)
- Battery (optional)
If you don't know how to connect the modules to the Espruino then take a look at my last two posts data logger and alarm-system.
Gauges
The website needs to be small enough to fit into Espruino's memory. Therefore, we can't use existing JS gauge or graphic libraries because most of them are too big. Instead, I show you how to build your own small gauge library.
You can create nice gauges by using Scalable Vector Graphics (SVG). Mozilla has a good tutorial on how to create your own SVGs on their MDN website. It is also possible to use Adobe Illustrator or similar products.
First, let's create a vertical gauge
27 °C-2060
with following SVG code:
<svg viewBox="0 0 145 145">
    <rect x="30" y="25" width="30" height="100" fill="#edebeb"></rect>
    <rect x="30" y="55" width="30" height="70" fill="#1565c0"></rect>
    <text x="70" y="80" text-anchor="start" style="font-weight: 700;font-size: 1.3em;">27 °C</text>
    <text x="70" y="125" fill="#b3b3b3">-20</text>
    <text x="70" y="30" text-anchor="start" fill="#b3b3b3">60</text>
</svg>
The two rectangles draw a gray background and a blue one line to display the current value. The text values are drawn by the text elements. It is possible to style attributes like color or font with CSS. We will use CSS styling for our library.
To make this gauge re-usable we will take the above SVG snippet and build a simple JS gauge library. The library provides two gauge types: Vertical Gauge and Radial Gauge.
With the library a vertical gauge can be created with: createVerGauge('id', -20, 60, ' °C');. The gauge object has two functions setVal(value) and setColor(color) to change the value and color with JS.
The library code is straight forward. The create function contains the SVG snippet and all values are set by accessing the DOM elements of the SVG graphic with their unique id. Additionally each element has a CSS class attribute for further styling.
function createVerGauge(id, minVal, maxVal, unit) {
  var tmpl =
  '<svg class="vGauge" viewBox="0 0 145 145">'+
    '<rect class="vGauge-base" id="'+id+'_base" x="30" y="25" width="30" height="100"></rect>'+
    '<rect class="vGauge-progress" id="'+id+'_progress" x="30" y="25" width="30" height="0" fill="#1565c0"></rect>'+
    '<text class="vGauge-val" id="'+id+'_val" x="70" y="80" text-anchor="start"></text>'+
    '<text class="vGauge-min-val" id="'+id+'_minVal" x="70" y="125"></text>'+
    '<text class="vGauge-max-val" id="'+id+'_maxVal" x="70" y="30" text-anchor="start"></text>'+
  '</svg>';

  document.getElementById(id).innerHTML = tmpl;
  document.getElementById(id+'_minVal').textContent = minVal;
  document.getElementById(id+'_maxVal').textContent = maxVal;

  var gauge = {
    setVal: function(val) {
      val = Math.max(minVal, Math.min(val, maxVal));
      var height = 100/(maxVal-minVal) * (val-minVal);
      document.getElementById(id+'_progress').setAttribute("height", height);
      document.getElementById(id+'_progress').setAttribute("y", 25+(100-height));
      document.getElementById(id+'_val').textContent = val + (unit !== undefined ? unit: '');
      return gauge;
    },
    setColor: function(color) {
       document.getElementById(id+'_progress').setAttribute("fill", color);
       return gauge;
    }
  }

  return gauge;
}
And the corresponding CSS styles:
.vGauge {
  width: 145px;
  height: 145px;
}

.vGauge-base {
  fill: #edebeb;
}

.vGauge-progress {

}

.vGauge-val {
  font-weight: 700;
  font-size: 1.3em;
}

.vGauge-min-val, .vGauge-max-val {
  fill: #b3b3b3;
}
The complete code (gauge.js and gauge.css) including the radiant gauge is available in the sample Github repo.
Website
The HTML code of the website includes the gauge library we just built and some Javascript code to retrieve temperature data. The refresh button SVG is from the Google Material Icon library.
<!DOCTYPE html>
<html>
<head>
    <meta charset="utf-8">
    <title>Weather Station WebUI</title>
    <link rel="stylesheet" href="dist/gauges.min.css">
    <link rel="stylesheet" href="dist/app.min.css">
</head>
<body>
    <h1>Weather Station</h1>
    <div>
        <div class="gauge-section">
            <h3>Humidity</h3>
            <div id="hum" class="gauge"></div>
        </div>
        <div class="gauge-section">
            <h3>Temperature</h3>
            <div id="temp" class="gauge"></div>
        </div>
    </div>
    <div class="actions">
        <button id="refresh" class="btn btn-icon">
            <svg height="30" viewBox="0 0 24 24" width="30">
                <path d="M17.65 6.35C16.2 4.9 14.21 4 12 4c-4.42 0-7.99 3.58-7.99 8s3.57 8 7.99 8c3.73 0 6.84-2.55 7.73-6h-2.08c-.82 2.33-3.04 4-5.65 4-3.31 0-6-2.69-6-6s2.69-6 6-6c1.66 0 3.14.69 4.22 1.78L13 11h7V4l-2.35 2.35z"/>
                <path d="M0 0h24v24H0z" fill="none"/>
            </svg>
        </button>
    </div>

    <script src="dist/gauges.min.js"></script>
    <script src="dist/app.min.js"></script>
</body>
</html>
The Javascript code (app.js) for the website creates two gauges. One for the humidity and one for the temperature.
var tempGauge = createVerGauge('temp', -20, 60, ' °C').setVal(0);
var humGauge = createRadGauge('hum', 0, 100, '%').setVal(0);
The temperature data is exposed as an API and can be retrieved by calling 'GET /data'. The refresh() function does exactly that. The data is refreshed once after the page is loaded and each time the refresh button is clicked.
function refresh() {
    var xmlHttp = new XMLHttpRequest();

    xmlHttp.onreadystatechange = function()
    {
        if (xmlHttp.readyState == XMLHttpRequest.DONE) {
              if (xmlHttp.status == 200)
            {
                var data = JSON.parse(xmlHttp.responseText);

                tempGauge.setVal(data.temp);
                humGauge.setVal(data.hum);
            } else {
                console.log('Refresh failed: ' + xmlHttp.status);
            }
        }
    }

    xmlHttp.open("GET", "data", true);
    xmlHttp.send();
}

document.getElementById('refresh').addEventListener('click', refresh);
refresh();
The complete website code is available in the Github repo github.com/Schweigi/espruino-examples. The repo does also contain Gulp file to minify and inline the CSS and JavaScript files in order to generate one single HTML file.
API
After finishing the website, it's time to take a look at the Espruino code.
The website file is stored inside the PAGE variable. Run the Gulp file to generate the dist/index.htm file. After that, you can use Gordon's file converter to make a single valid JS string of the HTML file. Copy the string into the PAGE variable.
If you don't know how to do that, take a look code inside the GitHub repo. The sample source does already contain the correct PAGE variable.
Don't forget to insert the correct the WiFi SSID and password before uploading the code to the Espruino.
I2C1.setup({sda:B7, scl:B6});
Serial2.setup(9600, { rx: A3, tx : A2 });

var PAGE = "";

var WIFI_NAME = '<ssid>';
var WIFI_PASS = '<password>';
var READ_INTERVAL_S = 5;
var PORT = 80;
var HTTP_OK = 200;
var HTTP_NOTFOUND = 404;

var lastTemp = 0;
var lastHum = 0;
var wifi = require('ESP8266WiFi');
var htu = require('HTU21D').connect(I2C1);
I won't go into much detail on how to read the temperature and humidity as this is covered by a previous blog post.
All the major work of the API is done inside the pageHandler function. The function provides the router and returns either the website or the temperature data depending on the request.
function pageHandler(req, res) {
  flashLED(LED2);

  var reqUrl = url.parse(req.url, true);

  if (reqUrl.pathname === '/' &&
      req.method === 'GET') {
    res.writeHead(HTTP_OK, {'Content-Type': 'text/html'});
    res.end(PAGE);
  } else if (reqUrl.pathname === '/data' &&
             req.method === 'GET') {
    var data = {
      temp: lastTemp,
      hum: lastHum
    };

    res.writeHead(HTTP_OK, {'Content-Type': 'application/json'});
    res.end(JSON.stringify(data));
  } else {
    res.writeHead(HTTP_NOTFOUND);
    res.end("Not found");
  }
}

var con = wifi.connect(Serial2, function(err) {
  if (err) throw err;

  con.reset(function(err) {
    if (err) throw err;

    console.log("Connecting to WiFi");
    con.connect(WIFI_NAME, WIFI_PASS, function(err) {
      if (err) throw err;

      console.log("Connected");
      con.getIP(function(err, ip) { console.log(ip); });

      require("http").createServer(pageHandler).listen(PORT);
    });
  });
});
Run the Weather Station
Upload the code and wait until the Espruino IP address is printed in the terminal. You can then browse to the web UI with the following URL: http://IP.
If you have a battery then attach the battery to the Espruino and disconnect the USB cable. Your weather station is ready for productive usage :)
As usual, the complete sample code is available in the GitHub repo github.com/Schweigi/espruino-examples.
Let me know if you make your own weather station and send me some pictures!